Annual Loss Expectancy in Quantitative Risk Analysis

In the digital age, mastering Annual Loss Expectancy (ALE) is essential for cybersecurity risk management. This guide delves into ALE's role in risk assessment methodologies, exploring qualitative and quantitative approaches, and advocating for a balanced strategy.

Cybersecurity risk management is now a foundational element of regulatory compliance across the European Union. Frameworks and directives, such as ISO/IEC 27001 and the NIS2 Directive, require organizations to identify, assess, and mitigate cyber risks in a systematic, repeatable way. Under NIS2, cyber risk management is elevated to a board-level responsibility, with significant penalties for non-compliance. In this environment, Quantitative Risk Analysis methods are gaining traction because they offer objective, data-driven insights. Unlike qualitative risk scoring (e.g., “high/medium/low”), quantitative approaches assign explicit numerical values to each risk component, enabling organizations to make informed decisions. A central metric in this approach is Annual Loss Expectancy (ALE), the projected annual financial loss attributable to a specific risk. By translating cyber threats into monetary terms, ALE helps security professionals communicate risk in the language of the business. This comprehensive guide explains what ALE is, how to calculate it, and how to integrate it into your cybersecurity program to meet European regulatory requirements.
What Is Annual Loss Expectancy (ALE)?
Annual Loss Expectancy (ALE) is a core quantitative risk metric that estimates the expected monetary loss from a defined risk over the course of one year. In essence, ALE answers the question:
“How much financial damage could this threat cause in a single year?”
ALE is calculated by multiplying two components:
- Single Loss Expectancy (SLE) – the estimated loss from a single occurrence of the risk.
- Annual Rate of Occurrence (ARO) – the expected frequency of that occurrence within a one-year period.
Formally:
ALE = SLE × ARO
Components of ALE
- Asset Value (AV)
The monetary value of the asset at risk (for example, the value of a sensitive database, critical system, or vital business process). - Exposure Factor (EF)
The percentage of the asset’s value expected to be lost if the risk event occurs (for example, a 30% loss of value in the event of a data breach). - Single Loss Expectancy (SLE)
Defined asAV × EF. SLE represents the cost of a single incident. If a database is valued at €100,000 and a breach is expected to cause a 30% loss, then SLE = €100,000 × 0.3 = €30,000. - Annual Rate of Occurrence (ARO)
The estimated number of times the event will occur in one year. ARO is typically derived from historical incident data, industry benchmarks, or expert judgment. For instance, if a particular breach is expected to occur once every two years, ARO = 0.5 (i.e., 0.5 occurrences per year).
Multiplying SLE by ARO yields the Annual Loss Expectancy (ALE), the average annual monetary loss for that risk scenario. Following the example above (SLE = €30,000; ARO = 0.5),
ALE = €30,000 × 0.5 = €15,000
This indicates an expected loss of €15,000 per year due to that specific risk event. By converting diverse cyber threats into standardized financial figures, ALE enables organizations to prioritize risk mitigation efforts based on potential impact.
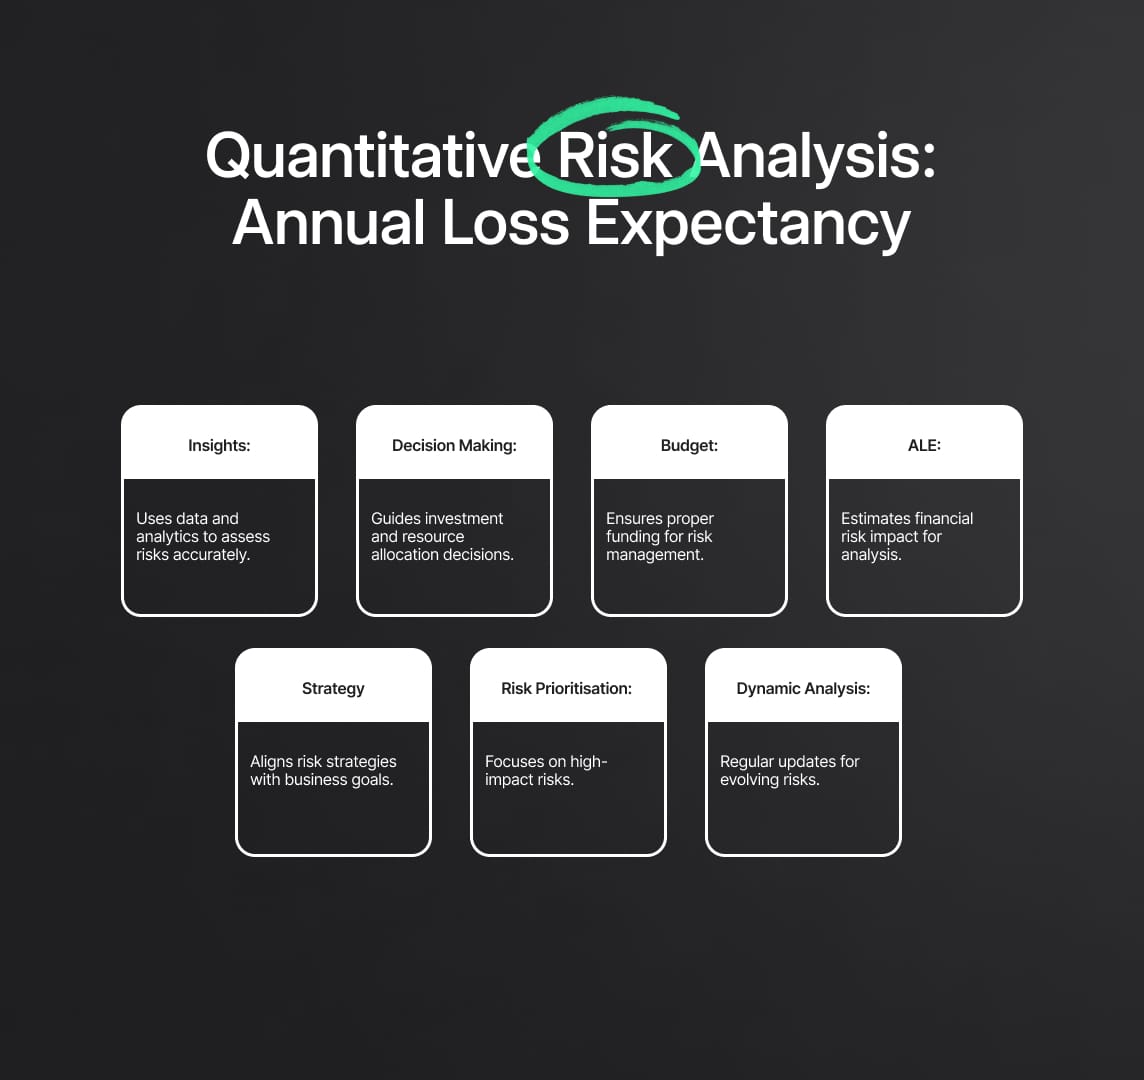
Why ALE Matters for Quantitative Risk Analysis and Compliance
- Unified Financial Language
- Annual Loss Expectancy translates complex cyber risks into a single, uniform monetary value.
- This common unit of measure allows decision-makers, from IT teams to C-suite executives, to compare risks side by side in purely financial terms.
- Regulatory Alignment and Governance
- EU regulations (e.g., NIS2) require organizations to quantify risk “in terms of likelihood and impact.” ALE directly addresses the impact side by providing a numerical estimate of loss.
- Demonstrating a quantitative methodology, especially one centered on ALE, reinforces compliance with frameworks like ISO/IEC 27001.
- Budgeting and Resource Allocation
- Using ALE, organizations can allocate security budgets according to the expected annual cost of each risk scenario.
- Controls and countermeasures are only justified if their cost is less than the reduction in ALE, ensuring efficient investment.
- Executive and Board Communication
- Financial figures resonate more clearly with executives and board members than abstract risk ratings.
- Presenting ALE calculations as part of a Quantitative Risk Analysis promotes transparency and fosters informed support for security initiatives.
- Cost-Benefit Analysis
- ALE helps quantify the return on investment (ROI) for security controls. For example, if implementing a new control costs €20,000 per year but reduces ALE from €50,000 to €10,000, the net benefit is €40,000 annually, making the control clearly worthwhile.
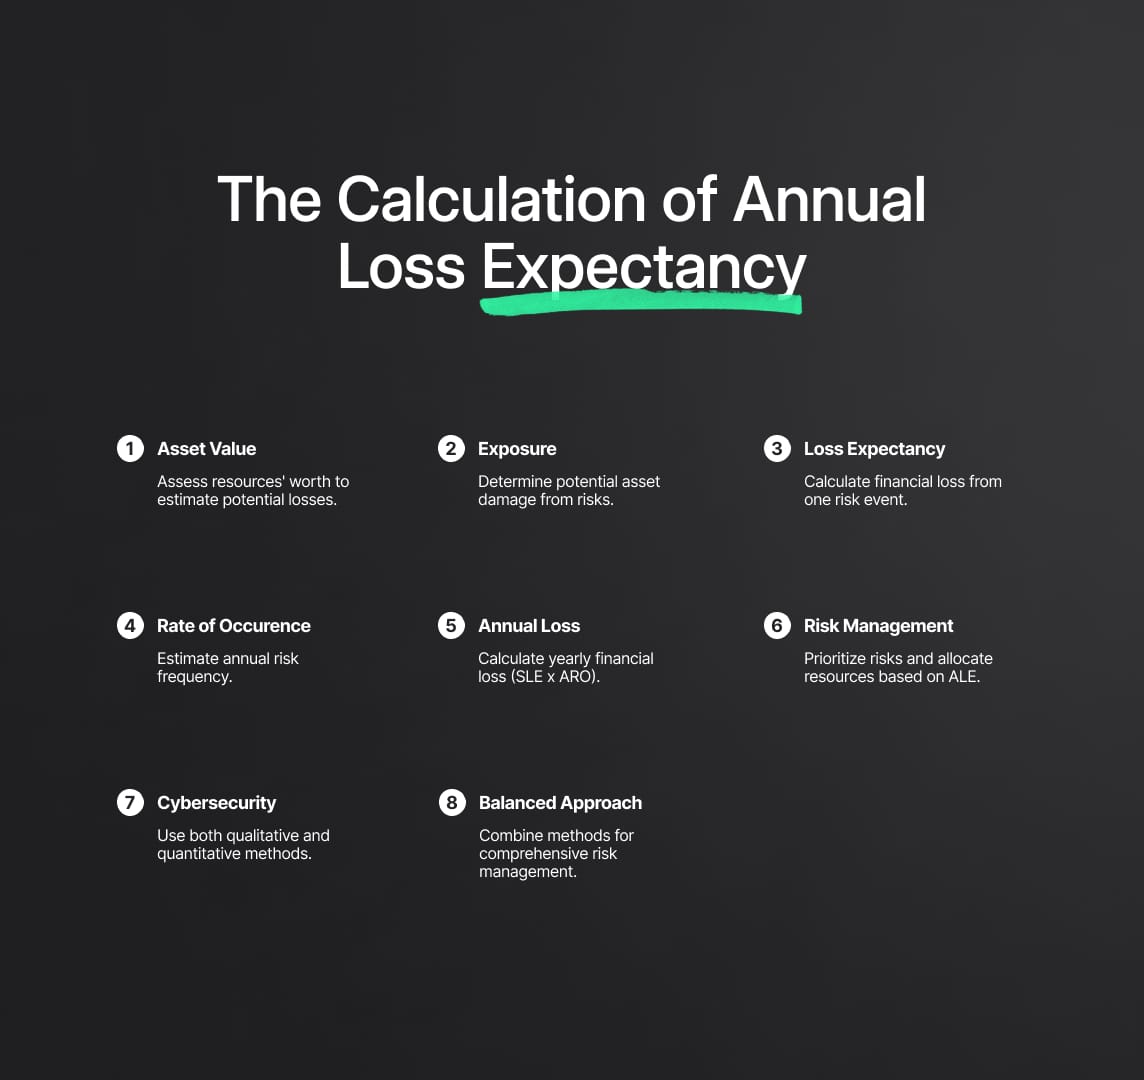
Step-by-Step Calculation of ALE (Quantitative Risk Analysis in Practice)
Calculating Annual Loss Expectancy (ALE) requires a systematic quantitative risk assessment that transforms abstract threats into concrete financial figures. The following structured approach ensures rigor, consistency, and alignment with best practices in Quantitative Risk Analysis:
1. Identify Assets and Determine Asset Value (AV)
- Inventory Critical Assets: Catalog all assets that support your organization’s mission, including databases, servers, applications, business processes, intellectual property, and sensitive data.
- Assign Monetary Value (AV): For each asset, estimate its worth in euros (or local currency). This may be based on replacement cost, development expenses, revenue generation, or impact on operations. For example, an intellectual property database developed over multiple years might be valued at €500,000.
2. Determine the Exposure Factor (EF) for Each Threat Scenario
- Define Threat Scenarios: List plausible cyber threats, such as ransomware, data exfiltration, system outages, insider fraud, or supply-chain compromise, that could affect each asset.
- Estimate Impact Severity (EF): For each scenario, calculate the percentage of AV likely to be lost if the event occurs.
- Worst-Case Impact: Consider the maximum foreseeable damage (e.g., a full data wipe might be 100% loss).
- Typical Impact: Balance worst case against historical or industry data; for example, a ransomware attack could typically encrypt and prevent access to 50% of a database’s value (EF = 0.5).
- Document EF Rationale: Note the data sources or expert judgments used to estimate EF. This transparency supports trustworthiness and helps refine calculations over time.
3. Calculate Single Loss Expectancy (SLE)
- Formula:
SLE= AV × EF - Interpretation: SLE represents the expected monetary loss from a single occurrence of the risk event.
- Example Calculation:
- If an asset (AV) is valued at €500,000 and an estimated ransomware incident yields an EF of 0.5, then:
SLE = €500,000 × 0.5 = €250,000 - This means a single major ransomware event on that asset is projected to cost €250,000 in direct and indirect damages (e.g., recovery, downtime, data reconstruction).
- If an asset (AV) is valued at €500,000 and an estimated ransomware incident yields an EF of 0.5, then:
- Maintain Traceability: Document calculations and assumptions to demonstrate the rigor of your Quantitative Risk Analysis process.
4. Estimate the Annual Rate of Occurrence (ARO)
- Define Frequency Metrics: ARO represents how often a risk event is expected to occur within a one-year period.
- Data Sources for ARO:
- Historical Incident Data: Use internal incident logs, past breach reports, or industry breach statistics to estimate frequency.
- Threat Intelligence: Leverage external threat feeds or sector-specific reports to forecast how often similar events occur.
- Expert Judgment: Engage subject-matter experts to refine ARO estimates when data is sparse.
- Example Estimations:
- If ransomware attacks similar to the scenario occur once every four years on average, set ARO = 0.25 per year.
- If minor service outages happen five times per year, set ARO = 5.
- Document Uncertainty Ranges: Capture high- and low-bound estimates for ARO, reinforcing transparency and enabling sensitivity analysis later.
5. Compute Annual Loss Expectancy (ALE)
- Formula:
ALE= SLE × ARO - Interpretation: ALE quantifies the average yearly financial loss attributable to a single threat scenario.
- Illustrative Examples:
- Ransomware Scenario:
- SLE = €250,000; ARO = 0.25 per year
- ALE = €250,000 × 0.25 = €62,500 per year
- This indicates an expected annual loss of €62,500 if no additional controls are in place.
- Minor Outage Scenario:
- Assume SLE = €25,000 (e.g., 5% of a €500,000 asset); ARO = 5 per year
- ALE = €25,000 × 5 = €125,000 per year
- Indicates a higher annual loss from frequent but smaller incidents.
- Ransomware Scenario:
- Contextualizing ALE: Use ALE figures to compare disparate threats on a level playing field, prioritizing mitigation for the highest dollar-value risks.
6. Validate and Refine Inputs
- Review Asset Valuations (AV): Confirm that market changes, depreciation, or strategic shifts haven’t altered AV since the last assessment.
- Reevaluate Exposure Factors (EF):
- Regularly test worst-case versus average-case scenarios.
- Incorporate new intelligence on threat actor tactics, techniques, and procedures (TTPs).
- Update Annual Rate of Occurrence (ARO):
- Adjust ARO based on evolving threat landscape, attack frequency trends, or improved detection and reporting practices.
- Consider leveraging statistical approaches, such as Monte Carlo simulations, to model distributions of outcomes and capture uncertainty more precisely.
- Document Validation Activities: Maintain a clear audit trail of every adjustment, ensuring that your Quantitative Risk Analysis remains auditable and compliant with frameworks like ISO/IEC 27001 and NIST SP 800-30.
7. Integrate ALE Results into Risk Management
- Prioritize Controls Based on ALE Reduction:
- Compare the cost of new or enhanced security controls against the reduction in ALE they deliver.
- For example, if advanced monitoring costs €8,000 per year and reduces the ransomware ARO from 0.25 to 0.1 (reducing ALE from €62,500 to €25,000), the net annual benefit is €29,500, justifying the investment.
- Inform Budgeting and Planning:
- Allocate security budgets toward controls that deliver the greatest reduction in Annual Loss Expectancy.
- Revisit these allocations periodically as ALE values change with new data or shifting priorities.
- Drive Executive and Board Discussions:
- Present ALE figures in clear, concise tables or dashboards.
- Use consistent terminology and units (e.g., euros per year) to build trust and facilitate decision-making among stakeholders.
- Monitor and Report Over Time:
- Track actual incident costs and frequencies to compare against ALE projections.
- Adjust your quantitative models to improve accuracy, reinforcing the organization’s overall maturity in Quantitative Risk Analysis.
ALE in EU Cybersecurity Compliance and Frameworks
Modern cybersecurity regulations and frameworks prioritize a risk-based approach, and integrating Annual Loss Expectancy (ALE) into your Quantitative Risk Analysis provides a clear, auditable way to demonstrate compliance. Below, we break down how ALE aligns with key EU and international standards, showcasing its role in satisfying regulatory requirements and reinforcing trustworthiness.
ISO/IEC 27001: Embedding ALE in Information Security Risk Assessments
- Risk Assessment Requirements
- ISO/IEC 27001 mandates that organizations perform a repeatable, documented information security risk assessment that aligns with business objectives.
- While ISO/IEC 27001 does not prescribe specific formulas, it encourages organizations to evaluate both likelihood and impact for each risk.
- Using ALE for Impact Quantification
- By calculating ALE, multiplying Single Loss Expectancy (SLE) by Annual Rate of Occurrence (ARO), organizations produce a concrete financial impact value for each risk.
- This numerical metric strengthens risk reporting, as stakeholders can compare different scenarios in euros per year rather than abstract ratings.
- Prioritizing Controls with Cost-Effectiveness
- ISO 27001 requires that selected controls be cost-effective and proportional to identified risk levels.
- If a proposed control costs less than its corresponding ALE reduction, it meets ISO’s “treat risks consistent with business objectives” principle. For instance, if a €20,000 control reduces ALE by €50,000 annually, it clearly aligns with ISO’s mandate.
- Demonstrating Due Diligence and Expertise
- Documenting ALE calculations and assumptions (AV, EF, SLE, ARO) evidences a robust, expertise-driven risk process.
NIST Cybersecurity Framework (CSF) & NIST SP 800-30: Leveraging Quantitative Risk Insights
- Widespread Adoption by EU Organizations
- Although originally developed in the United States, the NIST CSF serves as a de facto best practice for many EU entities seeking a comprehensive cybersecurity roadmap.
- NIST guidance encourages organizations to quantify risk “where possible,” making Quantitative Risk Analysis an accepted technique under NIST CSF.
- NIST SP 800-30: Annualized Loss Expectancy Guidance
- NIST Special Publication 800-30 explicitly describes Annualized Loss Expectancy (ALE) as a recognized method to estimate annual financial impacts of threat events.
- NIST recommends reporting both Single Loss Expectancy (SLE) and Annualized Loss Expectancy (ALE) so decision-makers understand one-time losses and recurring risk exposures.
- Integrating ALE into the NIST Identify-Protect-Detect-Respond-Recover Functions
- Identify: Use ALE during asset inventory and risk identification to assign monetary values to potential incidents.
- Protect: Prioritize security controls that deliver the greatest reduction in ALE, ensuring budget allocation reflects the highest return on investment.
- Detect, Respond, Recover: Track incident costs and actual frequencies over time to compare against ALE estimates, feeding lessons learned back into risk models.
- Reinforcing Trust with Stakeholders
- Presenting ALE metrics in a NIST-aligned risk report (e.g., “ransomware SLE = €800,000; ARO = 0.25; ALE = €200,000”) demonstrates a methodical, data-driven approach.
- This level of transparency fosters confidence among regulators, partners, and boards, aligning your security program with global best practices.
ENISA Guidelines & EU Risk Management Standards: Merging Qualitative and Quantitative Approaches
- ENISA’s Risk Management Philosophy
- The European Union Agency for Cybersecurity (ENISA) publishes guidance that recognizes qualitative, quantitative, and hybrid risk assessment methods.
- ENISA emphasizes consistent risk evaluation (e.g., ISO 27005), encouraging organizations to adopt a structured approach.
- Complementing Qualitative Methods with ALE
- ENISA often recommends risk matrices and qualitative scales (e.g., “low/medium/high”). By introducing ALE, translating impact into euros per year, you provide added clarity and precision to qualitative findings.
- A hybrid model (qualitative likelihood × quantitative ALE for impact) satisfies ENISA’s call for “high common level of cybersecurity across Europe” by combining context with numeric rigor.
- Auditor-Friendly Reporting
- Auditors and national authorities seeking evidence of standardized risk methods will appreciate that ALE creates a transparent audit trail: asset valuations, exposure factors, and frequency estimates.
- Organizations using ALE in conjunction with ENISA’s qualitative guidelines can show both the reasoning behind risk ratings and the underlying financial justification.
- Early Adoption of Cyber Risk Quantification Tools
- As EU frameworks evolve, especially under NIS2, many companies are turning to specialized tools that compute ALE automatically, streamlining compliance and offering on-demand risk insights.
- Integrating ALE-centric tools demonstrates proactive alignment with ENISA’s push for robust, data-driven risk management.
EU NIS2 Directive: Elevating Risk Management Through Quantification
- NIS2’s Expanded Scope and Expectations
- The NIS2 Directive introduces stringent requirements for “essential and important entities” (e.g., energy, transport, finance, health) to implement comprehensive cybersecurity risk management.
- Article 21 mandates regular risk analysis and mitigation measures, codifying risk management as a board-level responsibility.
- ALE as a Compliance Enabler
- Although NIS2 is technology-neutral on methodology, using Annual Loss Expectancy directly supports compliance by quantifying the “impact” component in financial terms.
- Demonstrating that you have calculated ALE for major threats shows you understand both likelihood and impact, core premises of NIS2.
- Practical Application for NIS2 Entities
- Example: A hospital identifies that ransomware on its patient database has an SLE of €2 million (EF × asset value) and an ARO of 0.25. The resulting ALE is €500,000 per year.
- By documenting ALE, the hospital can justify investments, such as advanced segmentation or automated backups, by comparing mitigation costs against annualized losses.
- Driving Cyber Resilience and Financial Awareness
- NIS2 emphasizes “cyber resilience” and financial accountability for cyber risk. ALE enables organizations to quantify their financial exposure in a way that resonates with board members and regulators.
- When auditors or regulators request evidence of “standardized methods for identifying, assessing, and managing risks,” presenting ALE calculations meets this requirement in a clear, auditable format.
GDPR: Leveraging ALE for Privacy and Data Protection Risk Assessments
- GDPR’s Risk-Based Security Mandate
- While the General Data Protection Regulation focuses on protecting personal data and privacy, it also requires a risk-based approach to security (e.g., Article 32).
- Organizations must implement “appropriate technical and organizational measures” based on the level of risk to data subjects’ rights.
- Quantifying Data Breach Impact with ALE
- ALE helps translate potential GDPR fines, remediation costs, and reputational damage into a single monetary figure.
- For example, calculating an ALE of €200,000 for phishing-related data breaches allows teams to justify stronger controls, such as multi-factor authentication or advanced email filtering.
- Demonstrating Accountability and Continuous Improvement
- Documenting ALE before and after implementing privacy controls shows how risk exposure is decreasing over time.
- This evidence supports GDPR’s accountability principle: “we can demonstrate that our security measures reduce financial exposure.”
- Example: If ALE for data breaches falls from €200,000 to €100,000 after deploying a new data-loss prevention solution, the organization can prove to regulators that it is actively reducing risk.
- Aligning Privacy and Cybersecurity Budgets
- In highly regulated sectors (e.g., finance, healthcare), linking ALE figures from GDPR risk assessments with cybersecurity budgets ensures that privacy and security investments reflect the highest-risk scenarios.
- This unified approach satisfies both GDPR’s data protection requirements and EU cybersecurity mandates.
Key Benefits of Integrating ALE into EU Compliance Frameworks
- Clear Financial Justification for Controls
- When a control’s annual cost is less than its expected ALE reduction, it meets the “cost-effective” criteria found in ISO 27001, NIS2, and GDPR guidance.
- Enhanced Risk Prioritization
- ALE enables direct comparison across disparate threats (e.g., ransomware vs. insider fraud vs. supply-chain compromise) by expressing each in euros per year.
- Audit-Ready Documentation
- Quantitative metrics like ALE leave an auditable trail, covering asset valuation methods, EF calculations, and ARO data sources, making it easier to prove compliance during inspections.
- Board-Level Visibility
- Presenting risk in financial terms resonates with executives, facilitating faster approval of budgets and ensuring alignment between cybersecurity objectives and business strategy.
- Regulatory Alignment and Future-Proofing
- As EU regulations evolve, such as expanded scope under future NIS updates, having a robust ALE-based risk process ensures you remain compliant without needing major overhauls.
Use Cases and Strategic Applications of Annual Loss Expectancy (ALE)
Implementing Annual Loss Expectancy (ALE) in a Quantitative Risk Analysis framework unlocks powerful, practical benefits for cybersecurity leaders, compliance teams, and organizational governance.
1. Risk Prioritization and Ranking with ALE
Annual Loss Expectancy provides a uniform financial metric, expressed in euros per year—for comparing diverse risks. By calculating ALE for each threat, organizations can generate a ranked risk register, answering the critical question:
“Which risks should we tackle first?”
- Objective Comparison:
- Instead of subjective “high/medium/low” labels, ALE yields a precise number.
- Example: If Risk A has an ALE of €100,000 and Risk B has an ALE of €10,000, focus first on mitigating Risk A.
- Dashboard Visibility:
- Present the top ALE values in a management dashboard or risk register.
- Highlight the top 5–10 financial exposures to ensure leadership sees where the greatest potential loss resides.
- Consistency and Transparency:
- Document how each ALE figure was derived, listing asset value, exposure factor, SLE, and ARO, so stakeholders understand the quantitative rigor behind the ranking.
By using ALE to drive risk prioritization, limited resources (budget, personnel, time) are directed toward the threats that pose the largest expected annual loss, enabling more efficient risk treatment.
2. Budgeting and Resource Allocation Aligned to ALE
ALE translates abstract cybersecurity requirements into concrete financial figures, aligning perfectly with organizational budgeting processes. By aggregating ALE across all identified risks, security leaders can build a budget request rooted in reality.
- Justifying Budget Requests:
- Compute the total combined ALE for all critical cyber risks.
- Example: If the sum of ALE values equals €5 million, a CISO could justify a €1 million security budget by demonstrating that this investment reduces a significant portion of the annualized loss.
- Cost-Benefit Analysis Using ALE:
- For each proposed control or technology, estimate how much it will reduce ALE.
- Example: A new intrusion detection system costs €30,000/year. If it lowers the ALE of certain cyber-attacks from €100,000 to €0, the net benefit is €70,000—making it clearly worthwhile.
- On the flip side, if a control costs €50,000 but only cuts ALE by €10,000, it may not be justified.
- Rule of Thumb:
- A control should not cost more than the ALE reduction it provides.
- Embedding this rule into budget discussions underscores a data-driven approach, an indicator of expertise and trustworthiness.
- Alignment with Compliance Requirements:
- Demonstrating that security investments are directly tied to reducing ALE aligns with standards like ISO/IEC 27001, which mandates cost-effective controls relative to risk.
3. Calculating ROI of Security Investments via ALE
Moving beyond cost comparisons, ALE enables precise Return on Investment (ROI) calculations for each security initiative. Quantifying ROI in terms of how much ALE is reduced offers a clear validation of security spending.
- Estimating ALE Reduction:
- For any proposed security solution, estimate the residual ALE after implementation.
- Example: An email filtering solution costs €60,000/year. If phishing-related ALE is €60,000/year and the filter reduces that ALE to €20,000, the annual ALE reduction is €40,000.
- ROI Analysis:
- ROI Ratio = (ALE Reduction) / (Cost of Control).
- In the example above: €40,000 ALE reduction ÷ €60,000 control cost = 0.67. A ratio below 1:1 suggests renegotiation, further justification, or seeking alternative solutions.
- Conversely, if a control costs €20,000 and yields a €40,000 ALE reduction, ROI = 2:1, making it highly attractive.
- Demonstrating Expertise:
- Document the assumptions, likelihood of reduced incident frequency, impact severity improvements, and residual risk levels, to reinforce that ROI estimates are not arbitrary.
- Sharing detailed ROI analyses with finance stakeholders underlines expertise and builds trust.
- Continuous Improvement:
- After implementation, track actual incident costs and frequency against pre-implementation ALE projections.
- Refine future ROI assessments based on measured performance, demonstrating a commitment to ongoing improvement.
4. Informing Risk Transfer and Cyber Insurance Decisions
Transferring risk, whether through third-party outsourcing or insurance policies, hinges on an accurate understanding of expected annual losses. ALE provides that clarity.
- Determining Insurance Coverage Amounts:
- If the ALE for data breaches is €500,000 per year, a company might seek a cyber insurance policy with at least €500,000 in coverage.
- Evaluating the insurance premium plus deductibles (e.g., €100,000/year) against the ALE helps determine whether transferring that risk is cost-effective.
- Choosing Which Risks to Transfer:
- High-ALE risks (e.g., major ransomware events) become prime candidates for insurance, while low-ALE risks (e.g., minor system outages causing €5,000/year) might be retained and managed internally.
- Documenting ALE figures in insurance negotiations underscores maturity in risk management, potentially leading to more favorable premiums.
- Outsourcing Security Functions:
- For certain specialized functions, like 24/7 SOC monitoring, calculate the residual ALE reduction versus the outsourcing cost.
- Example: Outsourcing might cost €200,000/year but cut a €300,000/year ALE by 80%, yielding a €240,000 reduction, an ROI of 1.2:1, indicating that outsourcing is justified.
- Building Trust with Underwriters:
- Insurance carriers favor clients who can demonstrate quantitative risk models.
- Providing detailed ALE calculations for major threat scenarios signals to underwriters that the organization has a robust risk management process.
5. Incident Response Planning and Business Continuity Driven by ALE
Knowing the Annual Loss Expectancy for various threat scenarios guides decisions on incident response capabilities and disaster recovery investments. ALE quantifies how much downtime or data loss costs, shaping recovery strategies.
- Prioritizing Continuity Investments:
- If the ALE for a cloud service outage is €200,000/year, investing in a €50,000/year failover solution is justifiable because it reduces expected annual loss.
- Translate technical Recovery Time Objectives (RTOs) and Recovery Point Objectives (RPOs) into monetary impact, ensuring that continuity plans target the most financially significant risks.
- Sizing Incident Response Teams and Contracts:
- Determine how much to spend on a managed incident response retainer or emergency support.
- Example: A 24/7 incident response retainer costs €80,000/year but reduces ALE from €150,000 to €60,000. This €90,000 reduction exceeds the retainer cost, justifying the expense.
- Quantifying Maximum Tolerable Downtime:
- Convert downtime (in hours or days) into daily or hourly ALE to decide when to spin up backup systems or invoke crisis-management protocols.
- Example: If ALE per day of downtime is €10,000, the business knows that more than two days’ downtime (totaling €20,000) requires immediate escalation.
- Linking Business Continuity to Cybersecurity:
- By integrating ALE into both cybersecurity and business continuity planning, teams speak a unified language of financial impact, ensuring consistent priorities across departments.
6. Enhancing Compliance Reporting and Audit Evidence with ALE
Many EU regulations (ISO/IEC 27001, NIS2, GDPR) and internal policies require documented risk assessments and evidence of risk treatment. ALE-based analysis strengthens audit reports with tangible metrics.
- Quantifiable Risk Statements:
- Demonstrating Risk Reduction Over Time:
- Track ALE values before and after each mitigation to show regulators a clear downward trend in expected annual loss.
- Example: Under NIS2, a telecom operator might present a risk register sorted by ALE, with controls reducing the top five risk ALEs by 60% year over year.
- Aligning with NIS2’s Financial Focus:
- NIS2 calls for “standardized methods for identifying, assessing, and managing risks” in Article 21. ALE provides that standardized metric, helping firms demonstrate compliance in financial terms.
- During audits, showing that high-priority risks (by ALE) are addressed first illustrates a methodical approach rather than checkbox compliance.
- Supporting GDPR Data Protection Impact Assessments (DPIAs):
- In DPIAs, quantifying the monetary impact of a data breach (including fines, remediation, and reputational damage) through ALE brings clarity to data-protection risk.
- Example: If the ALE of personal data theft is €200,000/year, a DPIA can justify investing in stronger encryption or dedicated data-loss prevention (DLP) for at least a portion of that ALE.
- Fostering Trustworthiness and Audit Readiness:
- Auditors and regulators appreciate seeing detailed, numerical evidence that risk treatments are effective.
- ALE’s transparent methodology, documenting AV, EF, SLE, ARO, underscores organizational commitment to objective, data-driven decision-making.
Rather than stating “Risk X is high,” reports can declare:
“Risk X has an Annual Loss Expectancy of €250,000; residual ALE after controls is €50,000.”
7. Strategic Decision-Making and Governance Powered by ALE
At the highest level, Annual Loss Expectancy integrates cyber risk into enterprise risk management and influences strategic choices. Boards and executives gain a unified view of risk when cybersecurity is expressed in financial terms.
- Aligning Cyber Risk with Corporate Risk Registers:
- Add ALE values alongside financial, operational, and market risks in the enterprise risk register.
- Example: A board-level report might list “Data Breach ALE: €800,000,” “Supply Chain Disruption ALE: €600,000,” and “Market Volatility Exposure: €1 million.”
- Setting Financial Risk Appetite:
- Establish a cyber risk appetite threshold, for instance, “No single cyber risk should exceed €1 million ALE.”
- If any calculated ALE crosses that threshold, leadership triggers immediate action or additional investment.
- Informing Expansion and M&A Decisions:
- When contemplating a new market entry, calculate the ALE of region-specific cyber threats (e.g., increased ransomware risk in certain geographies).
- Compare the projected ALE against anticipated revenue to decide whether to delay, invest in controls, or reconsider the expansion.
- Integrating ALE into Product and Service Planning:
- For a new digital product launch, estimate the ALE from potential vulnerabilities or privacy breaches.
- Use that ALE figure to determine how much to invest in secure development, penetration testing, or ongoing monitoring.
- Facilitating Cross-Functional Dialogue:
- ALE provides a shared language, “risk equals money”, enabling cybersecurity teams, finance departments, legal, and operations to prioritize projects together.
- This fosters a culture of transparency and ensures governance decisions reflect a holistic understanding of organizational risk.
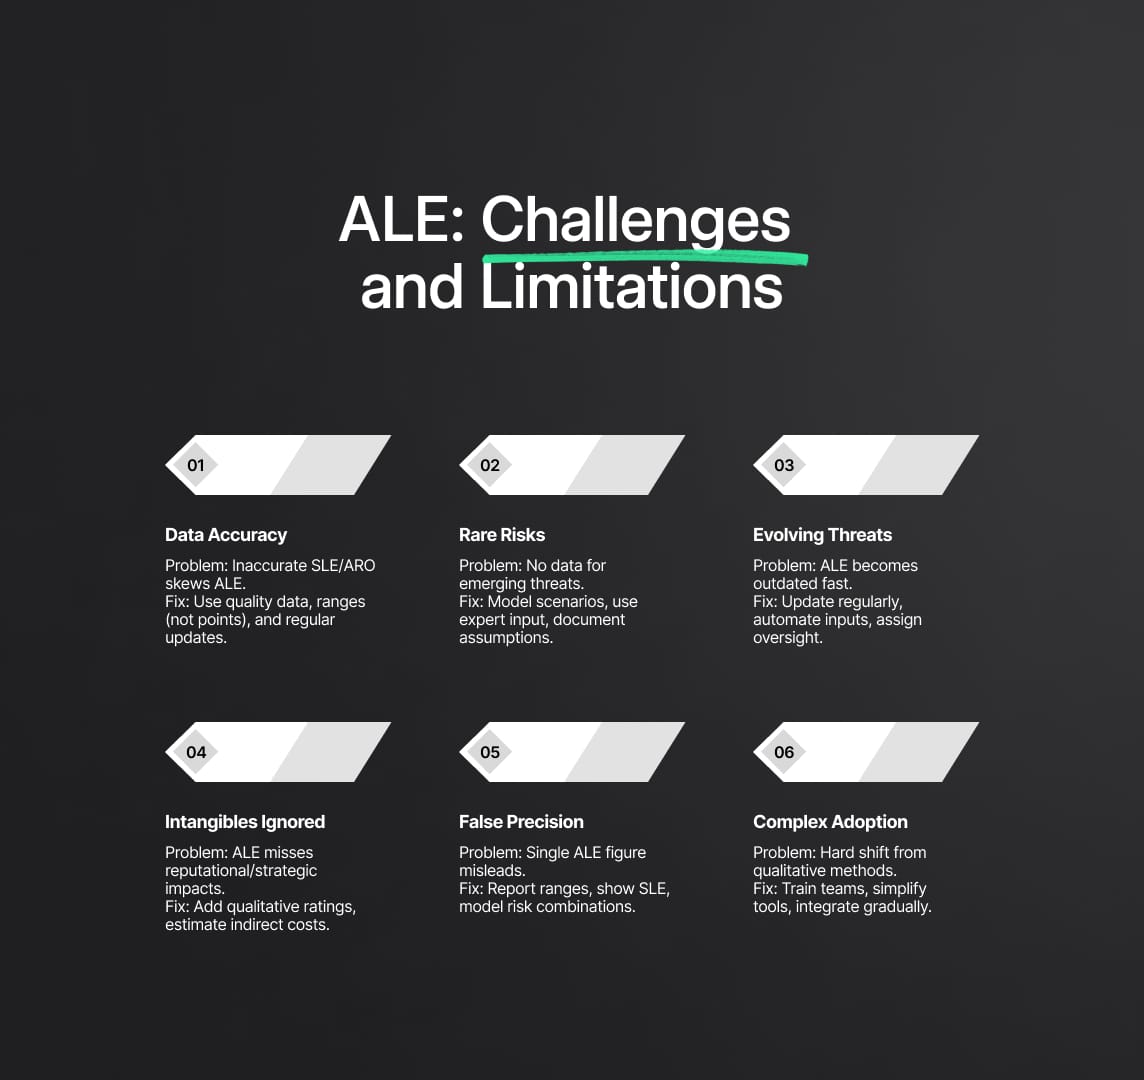
Challenges and Limitations of Annual Loss Expectancy (ALE)
Implementing Annual Loss Expectancy (ALE) within a Quantitative Risk Analysis framework brings significant clarity, but practitioners must be aware of its inherent limitations. Below, we detail the most common challenges and offer targeted solutions and best practices to ensure ALE remains a robust, trustworthy metric in your cybersecurity program.
1. Accuracy of Input Data
Challenge:
ALE depends entirely on the accuracy of its inputs, namely, Single Loss Expectancy (SLE) and Annual Rate of Occurrence (ARO). If asset values are guessed, exposure factors underestimated, or incident frequencies outdated, the resulting ALE can be wildly misleading. For example, underestimating the frequency of phishing attacks or failing to account for hidden costs (like investigation and customer notification) leads to SLE and ARO figures that skew ALE downward, creating a false sense of security.
Solution:
- Aggregate High-Quality Data: Leverage internal historical loss data, industry breach reports, and actuarial sources to inform SLE and ARO. Where possible, partner with insurance providers or third-party cybersecurity firms that compile extensive breach statistics.
- Use Ranges and Distributions: Instead of a single-point estimate (e.g., “ARO = 0.2”), define a range or probabilistic distribution for both SLE and ARO (e.g., “ARO between 0.1 and 0.4”). Applying techniques like Monte Carlo simulation turns ALE into a range of possible outcomes, highlighting confidence intervals rather than an imprecise “exact” number.
- Regular Data Refresh: Institute a schedule (quarterly or semi-annually) to update ARO and SLE based on new incident records, emerging threat intelligence, or changes in asset valuation. This ensures ALE reflects the current threat environment and business context.
2. Estimating Rare or Emerging Risks
Challenge:
Some threats, so-called “black swans” like zero-day exploits or novel supply-chain attacks, lack historical frequency data. Estimating ARO for these events is speculative at best, which can push ALE either to dangerously low values (if assumed ARO = 0) or unrealistically high (if worst-case scenarios dominate). In either case, decision-makers may dismiss a rare-but-catastrophic risk or over-allocate resources to an unlikely scenario.
Solution:
- Scenario-Based Modeling: Create multiple ALE scenarios based on different frequency assumptions. For example, calculate ALE assuming the event occurs once every 10 years (ARO = 0.1) and again assuming it happens once per year (ARO = 1.0). Present the range of ALE values so stakeholders see the potential variability.
- Expert Judgment & Delphi Method: Convene subject-matter experts in structured workshops to derive more realistic ARO estimates for emerging threats. The Delphi method, which uses iterative consensus-building among experts, can refine those estimates when data are scarce.
- Leverage Industry Sources: Use data from ENISA, CERTs, or sector-specific Information Sharing and Analysis Centers (ISACs) to inform baseline ARO guesses for new risk categories. Even if frequency data is limited, authoritative publications can guide a conservative default, such as assuming a low but non-zero ARO until more evidence emerges.
- Document Assumptions Transparently: Clearly record the rationale behind any ARO assigned to a rare event. When more information becomes available, update ALE accordingly to ensure continuous improvement.
3. Dynamic Threat Landscape
Challenge:
The cyber threat environment is in constant flux, attackers develop new tactics, vulnerabilities get patched, and business processes evolve. An ALE calculated six months ago may no longer reflect the current risk profile, leading to outdated priorities and misaligned budgets.
Solution:
- Living ALE Figures: Embed ALE calculation into a continuous monitoring cycle. Reassess ARO and SLE whenever a significant incident occurs, whether within your organization or across your industry, and on a regular cadence (e.g., every quarter).
- Automated Data Feeds: Deploy risk management platforms or Cyber Risk Quantification (CRQ) tools that ingest real-time threat intelligence and vulnerability data. Such platforms can automatically flag spikes in incident frequency, prompting ARO recalibration.
- Governance Process: Assign a dedicated risk owner or committee to review ALE inputs periodically. Use structured checklists, review asset values, validate exposure factors, and compare ARO against threat reports, to ensure no critical changes slip through the cracks.
- Align with NIST IR 8286 Guidance: Follow frameworks like NIST’s Integrated Risk Management (IRM) to document changes in threat frequency and adjust ALE inputs. Regularly capturing evolving risk data fosters a mindset of continuous improvement and preserves ALE’s relevance.
4. Intangible and Non-Monetary Impacts
Challenge:
ALE inherently focuses on direct monetary losses, such as incident response costs, regulatory fines, or system replacement expenses. It does not directly capture intangible repercussions like reputational damage, loss of customer trust, or long-term strategic setbacks. A data breach might incur €1 million in cleanup costs (SLE) but inflict far greater unquantified revenue loss due to brand erosion.
Solution:
- Parallel Qualitative Assessments: For each risk, supplement ALE with a qualitative impact rating (e.g., “Reputational Impact: High” or “Strategic Impact: Critical”). Present both metrics side by side so decision-makers see the full risk profile.
- Approximate Intangible Costs: Where feasible, estimate intangible impacts in financial terms. For example, use historical marketing or sales data to quantify revenue lost after past reputation-damaging events. Incorporate those figures into SLE, producing a more comprehensive ALE.
- Business Impact Analysis (BIA): Conduct a BIA to identify operational, strategic, and regulatory consequences of major incidents. Use BIA findings to enrich your risk register with narrative descriptions that highlight non-monetary effects.
Risk Descriptions and Contextual Notes: When reporting risk, explicitly state:
“This ALE figure does not account for potential market share loss or negative press.”
Such transparency maintains trustworthiness by acknowledging ALE’s scope and directing stakeholders to consider qualitative insights.
5. Over-Reliance and False Precision
Challenge:
Presenting ALE as a single number can create the illusion of pinpoint accuracy, leading some stakeholders to treat it as a definitive forecast rather than an estimate. Over-reliance on ALE can cause teams to overlook low-frequency, high-impact events (if ARO was estimated too low) or to ignore risk correlations (e.g., simultaneous breaches across multiple systems). Additionally, summing ALE across risks may understate total exposure if events can occur concurrently.
Solution:
- Report Ranges and Confidence Intervals: Whenever possible, express ALE as a range (e.g., “€100 k–€200 k, 90% confidence”). Use Monte Carlo simulation to show the distribution of potential losses around the ALE mean, emphasizing uncertainty.
- Present Worst-Case Single-Loss Scenarios: Alongside ALE, highlight the Single Loss Expectancy (SLE) to ensure stakeholders consider the magnitude of a one-off catastrophic event. This dual-metric approach prevents blindness to low-probability but severe incidents.
- Scenario Planning and Correlation Analysis: Model scenarios where multiple events occur in the same year (e.g., two ransomware attacks and a major DDoS). Calculate combined financial impact to show that the sum of individual ALE figures may understate potential aggregate losses.
- Educational Messaging: Emphasize in reports that ALE is an estimate, not a guarantee. Clearly document underlying assumptions, such as “ARO derived from the past three years of incident data” or “EF based on average breach severity”—so users understand the model’s limits.
- Expert Review Panels: Convene cross-functional committees (including finance, legal, and operations) to review ALE inputs and results. If a subject-matter expert senses that an ALE seems too low or too high, the team investigates underlying assumptions and adjusts accordingly.
6. Integration and Complexity Challenges
Challenge:
Introducing ALE and other quantitative methods into an organization previously reliant on qualitative risk assessments can be daunting. Collecting data, performing statistical calculations, and training staff in these new techniques require time and resources. Some managers may resist abandoning familiar heat-maps for spreadsheets or specialized software.
Solution:
- Pilot Projects: Start by calculating ALE for a small subset of high-priority risks. Demonstrate the value, clearer budget alignment, stronger audit evidence, and use early successes to build momentum.
- Training and Knowledge Transfer: Provide hands-on workshops or certification courses (e.g., FAIR, CRISC) focused on Quantitative Risk Analysis fundamentals: SLE, ARO, exposure factors, and Monte Carlo methods. Equip team members with the skills to collect data, run simulations, and interpret outcomes.
- Leverage Established Frameworks: Embed ALE into existing risk processes under ISO/IEC 27001 or NIST CSF rather than creating a parallel, standalone approach. Mapping ALE steps onto current risk assessment workflows minimizes disruption and underscores credibility.
- Adopt Purpose-Built Tools: Evaluate Cyber Risk Quantification (CRQ) platforms or risk-management suites that automate ALE calculations, integrate threat intelligence feeds, and generate dashboards. Even simple, standardized spreadsheet templates can help smaller teams consistently apply ALE formulas.
- Use FAIR Methodology if Appropriate: The Factor Analysis of Information Risk (FAIR) framework provides a structured taxonomy for quantifying risk. FAIR breaks down loss events into frequency and impact factors, aligning closely with ALE concepts (ARO and SLE) while adding rigor to how those inputs are derived.
- Iterative Rollout: Gradually expand ALE coverage, initially focusing on top-tier risks, then integrating mid- and lower-tier risks over time. Collect feedback from stakeholders and refine processes to ensure that quantification complexity remains manageable.
Reduce your
compliance risks
